J. Japan. Soc. Hort. Sci. 65(4) : 843-849. 1997.
Classification of Herbaceous Peony Cultivars by Random Amplified Polymorphic DNA (RAPD) Analysis
Takashi Hosoki1, Tomomi Nagasako1, Daisuke Kimura1 , Kaori Nishimoto1, Ryuichi Hasegawa1, Katsumi Ohta1, Mari Sugiyama2 and Kazuhisa Haruki2
1Faculty of Life and Environmental Science, Shimane University, Nishikawatsu-cho 1060, Matsue, Shimane 1690
2Shimane Agricultural Experiment Station, Ashiwata-cho 2440, Izumo, Shimane 693
Received; February 15. 1996. Accepted; June 7, 1996
Summary
Random amplified polymorphic DNA (RAPD) analysis was performed to classify 21 herbaceous peony cultivars or species. Forty 10-mer primers were screened; 11 of these produced 99 reproducible amplification DNA fragments, useful as polymorphic markers. With these markers 21 genotypes were distinguished and the similarity values among the genotypes calculated. A dendrogram by cluster analysis revealed that cultivars of P. lactiflora are clearly separated from those of P. officinalis which are related to cultivars of P. peregrina, P. tenuifolia, or Manchurian peony. Except for a few cultivars, those of P. lactiflora can be grossly divided into Japanese, Chinese and Western groups. The classification of 21 genotypes by RAPD corresponds well with their morphological and biochemical characteristics, e. g. with flavon/flavonol compounds in the petals, but not with the anthocyanidins.
Tables & Figures:
|
|
|
|
|
|
||||||
|
|
|
|
|
|
|
|
|
|
|
|
Introduction
Classification of herbaceous peony cultivars was based on seven types of flower shapes by Harding (1917). Today, his classification is inadequate to distinguish genetic relationships, information which is important for peony breeders. We attempted to make a new classification of popular cultivars to select potential parents and species for hybridization, based on the morphological characters and patterns of flavon/flavonol compounds in the petals (Hosoki et al.. 1991).. Our data provide some information for the classification and breeding of herbaceous peonies.
Recently, a direct analysis of DNA of cultivars or species has been shown to be effective in distinguish genetic relationships. Identification of azalea (Kobayashi et al., 1995) and rose (Takeuchi et al., 1995) cultivars has been achieved using random amplified polymorphic DNA analysis (RAPD) or restriction fragment length polymorphism (RFLP).
The objective of this study is to clarify genetic relationships of herbaceous peony cultivars by using RAPD with those based on morphology and flavon, flavonol or anthocyanidins in the petals (Hosoki et al.. 1991: Hosoki and Seo. 1991).
Materials and Methods
Six Japanese cultivars (Paeonia lactiflora), 'Haru-no-yosoi'. Taki-no-yosoi', 'Kashoku-no-ten'. 'Hyoten', 'Satsuki', and 'Kakouden'; four Chinese cultivars (P. lactiflora ), 'Yang qui fei'. 'Zi feng chao yang', 'Da hong bao', and "Zi fu rong'; four Western cultivars (P. lactiflora). 'La Tendresse', 'Sarah Bernhardt',' Karl Rosenfield', and 'Festiva Maxima'; a wild P. lactiflora, Manchurian peony (unidentified species); three cultivars of P. officinalis, 'Rosea Plena', 'Rubra Plena', and 'Alba Plena'; one cultivar of P. peregrina, 'Sunshine'; and a wild P. tenuifolia, were studied. The petal color, its dominant pigment, and origin of the cultivars or species are shown in Table 1. Experimental materials were obtained from a peony collection maintained at Shimane University, Matsue, Shimane Pref.
DNA extraction.
Young immature leaves were collected in the spring of 1995 and stored at -20 °C before DNA extraction. Total DNA was extracted by slicing leaves (100 mg fw per cultivar or species) based on Isoplant Manual of DNA extraction kit (Nippon Gene Co. Ltd., Tokyo, Japan). The extract was dissolved with 50 micro-l of 10 mM Tris-HCl and 1 mM EDTA (pH 8) (TE) buffer. The extract with this kit does not produce amplified DNA products by polymerase chain reaction (PCR); hence, a sample was re-extracted four times according to Stewart and Via (1993). Re-extracted DNA was re-dissolved with 50 micro-l TE buffer.
DNA amplification.
Forty 10-mer primers (oligonucleotides)(kit A and B, Operon Technologies, Alameda, Calif., USA) were tested. Amplification reactions were conducted in 25 micro-l volumes containing 10 mM Tris-HCl (pH 8.3). 50 mM KC1, 2.5 mM MgCl2, 0.2 mM each of dATP, dGTP. dCTP, and dTTP, 2 micro-M primer, 0.05 units / micro-l Taq DNA polymerase (Takara, Co. Ltd., Ohtsu, Shiga, Japan) and about 0.7 micro-g genomic DNA dissolved in 1 micro-l TE. Each reaction mixture was overlaid with a bit of mineral oil to prevent evaporation. Reactions were performed in a Perkin Elmer Cetus Gene Amp PCR system 9600 (Foster, Calif., USA) programed as follows: 3 min at 94 °C for initial strand separation, 50 cycles of 45 sec at 94 °C, 1 min at 40 °C and 1 min at 72 °C, followed by 5 min at 72 °C for final extension. PCR products were stored at 4 °C before analysis. Amplification products were analyzed by gel electropnoresis in 1.5% agarose S (Nippon Gene Co. Ltd., Tokyo Japan) in TAE buffer containing 0.04 M Tris-acetate and 0.001 M EDTA, stained with ethidium bromide and photographed under UV light (365 nm) using a Type 337 Polaroid film. Approximate molecular sizes of amplification products were estimated using a DNA size marker, lambda/hind III digest-phi-chi 174/Hinc II digest (Toyobo Co., Tokyo, Japan). All reactions were repeated twice, and only reproducible bands were used for data analysis.
Data analysis
Stable amplification bands were analyzed by paired comparisons of the genotypes based on the percentage of common fragments and the similarity matrix was estimated (Nei and Li, 1979). A dendrogram was constructed, using the similarity matrix data by the unweighted paired group method with arithmetic average (UPGMA) cluster analysis (SYSTAT program of Macintosh. Apple Computer Inc., Calif., USA).
Results and Discussion
Herbaceous peony (Paeonia officinalis) cultivars were appreciated in European countries between the 15th and 18th centuries (Tsukamoto. 1984; Wister and Hoife, 1962). However, breeding for flower shape and color did not begin until the 19th century when P. lactiflora, native to China (Bailey, 1976), was introduced to Europe. Many cultivars with various flower shapes were derived from P. lactiflora. In China, ornamental cultivars were developed in the 6th-7th centuries from medicinal plants of this species (Tsukamoto, 1969). P. lactiflora was introduced to Japan before the 10th century and subsequently many cultivars were created by selfing or crossing, especially during the middle Edo period (18th century) to early Showa period (20th century) (Tsukamoto, 1984).
The classification of herbaceous peony cultivars was based on flower-shapes (Harding, 1917), morphology, and/or petal flavon/flavonol compounds (Hosoki et al., 1991). In this report we show genetic relationships among cultivars by directly comparing their DNA bands obtained by RAPD.
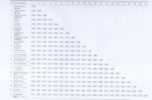
Among 40 primers tested, 11 primers produced suitable numbers of DNA bands (5 to 15 per primer) for data analysis of 21 genotypes. Primers which produced a few or more than 16 bands were not used for data analysis because making distinctions among genotypes was difficult. A total of 129 bands were produced from 11 primers (Table 2), ranging in size from 300 to 1350 base pairs.
Figure 1 shows an example of an amplification pattern obtained with primer OPB-19. Using 99 polymorphic bands obtained from 11 primers, 21 genotypes were classified (Table 3) among which 14 bands were present or absent in only one genotype. These bands were considered as genotype-specific markers (Table 4), useful for identification of some species or cultivars.
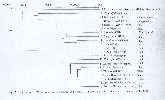
The dendrogram (Fig. 2) generated from similarity values among genotypes (Table 3) reveal that cultivars of P. lactiflora are clearly distinguishable from those of P. officinalis, P. tenuifolia and Manchurian peony at similarity value, 0.695. Cultivars #17. #18, and #19 of P. officinalis, belong to one section, related to 'Sunshine' ( #20) of P. peregrina. The two peonies, #21 and #16, representing P. tenuifolia and Manchurian peony, respectively, are further separated. Japanese cultivars, #3, #4, #5, and #6, Chinese cultivars. #8, #9, and #10, and Western cultivars, #11, #12, #13, and #14 in P. lactiflora are classified into separate sections: a Chinese cultivar, 'Yang qui fei' (#7) belong to the Japanese group and: the two Japanese cultivars, 'Haru-no-yosoi' (#1) and 'Taki-no-yosoi' ( # 2) belong to Chinese group. Thus, a tentative grouping of cultivars in P. lactiflora was made, but the similarity values between the cultivars ranged from 0.854 to 0.966, indicating that the genetic difference among the cultivars was not large. Thus, for further breeding of cultivars of P. lactiflora, hybridization with the other species such as P. officinalis or P. peregrina is recommended (Somei, 1986).
From cluster analysis of morphology, Hosoki et al. (1991) reported that cultivars of P. officinalis were related closer to P. tenuifolia or Manchurian peony than to those of P. lactiflora. Green (1951) established that P. officinalis and P. peregrina were taxonomically closer to P. tenuifolia than to P. lactiflora from study based on morphological differences in floral organ, stem. and leaf characteristics. Recently, Sang et al. (1995) reported that P. officinalis was closer to P. tenuifolia and P. peregrina than to P. lactiflora based on their nucleotide sequence of nuclear ribosomal DNA in Paeonia spp. These results are consistent with those of the present classification by PCR-RAPD analysis. Among the cultivars of P. lactiflora, Japanese and Western groups were separated into different sections according to morphological analysis (Hosoki et al., 1991); Chinese cultivars were not examined. This morphological classification of cultivars approximated that based on our PCR-RAPD analysis.
As for the classification by flavon/flavonol compounds in the petal, Hosoki et al. (1991) reported that cultivars of P. lactiflora were clearly different from those of P. officinalis . However, cultivars in P. lactiflora or those in P. officinalis could not be distinguished individually because their petals contained only three polymorphic compounds; whereas PCR-RAPD analysis can distinguish all cultivars by using 99 polymorphic DNA bands.
A genetic classification of cultivars based on anthocyanidins was difficult because most of cultivars in P. lactiflora and P. officinalis contained similar types of anthocyanidins, peonidin, or peonidin/cyanidin in the petals (Table l)(Hosoki and Seo, 1991). In this study, however, white cultivars (e. g., #4 and #6, or #11 and #14), which were difficult to distinguish from petal color. could be discerned from difference in polymorphic DNA bands.
Thus. DNA fragments amplified with random primers are non-specific; they segregate independent of morphological characters and petal pigments but reveal the DNA components innate to the respective genotype.
We conclude that a classification of herbaceous peony cultivars by RAPD may be a useful tool to distinguish cultivars whose flower color or morphology are similar. It may give useful information for selecting parents with different gene components to obtain attractive, vigorous hybrids.
Table 1. Petal color, petal pigment and origin of 21 herbaceous peony genotypes used for this study
Table 2. List of the primers that produced RAPD polymorphisms among 21 herbaceous peony genotypes.
Table 4. Genotype-specific RAPD markers.